January 22nd, 2026
Project moneys & Fixed price project progress%
Hi Operating admins, we’re happy to report progress again. Lots of money in the letter today.
Project detail page shows status
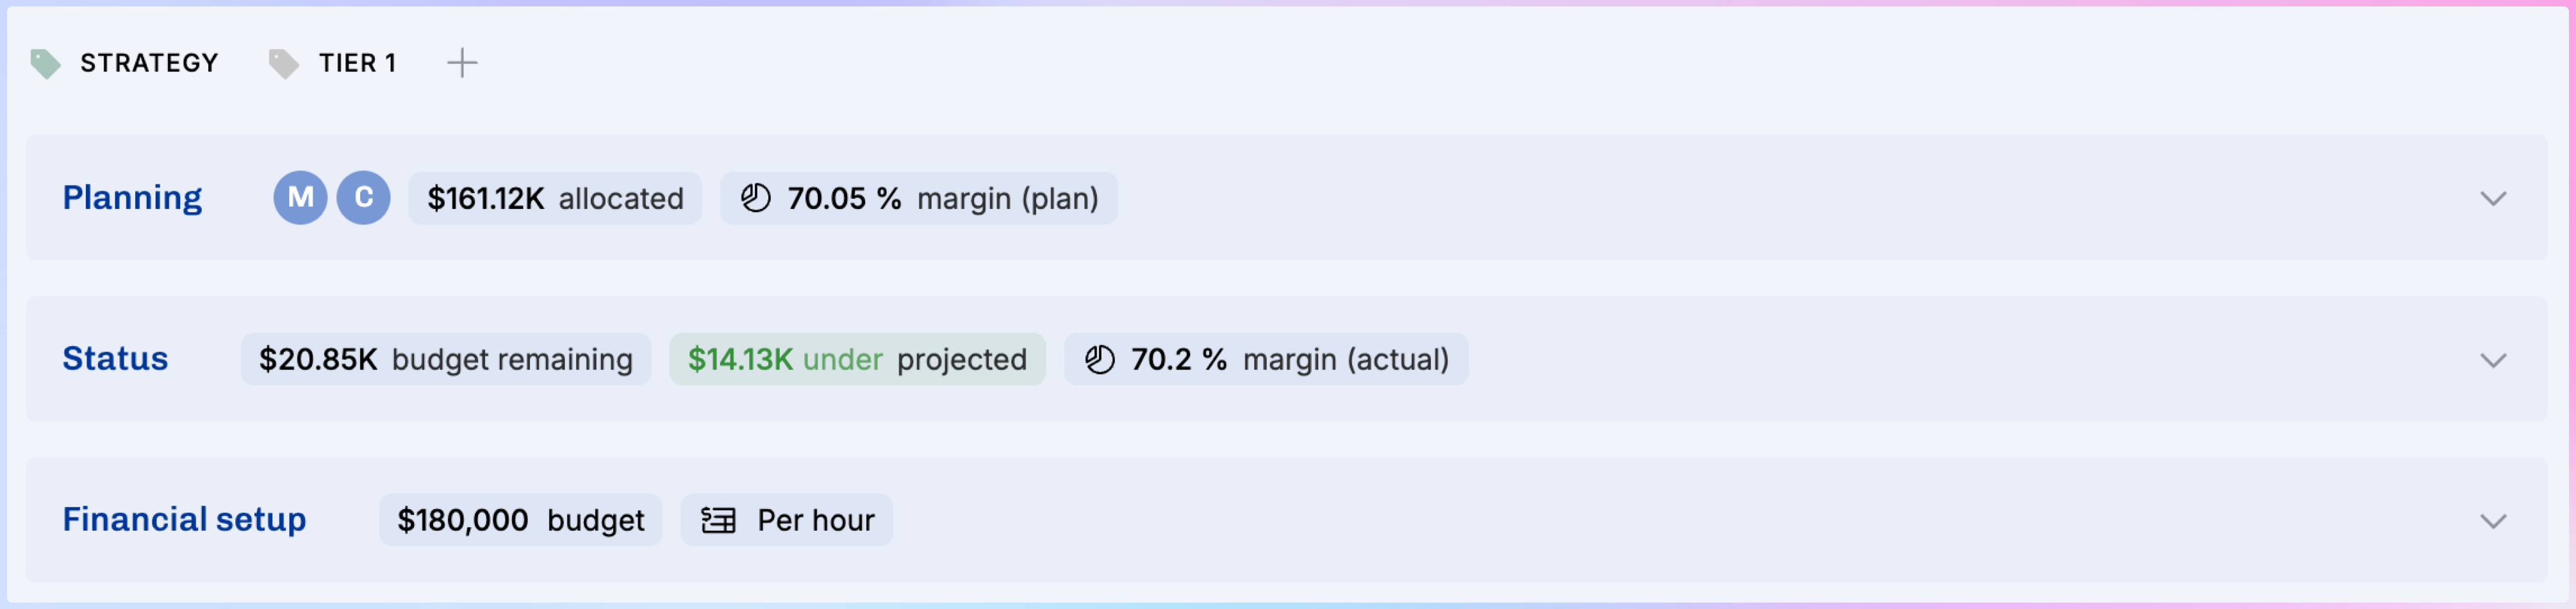
When you look at any project’s details, you can now see profitability and projected outcomes at a glance. We moved the sections around a bit to make this clear. Status is a new section, and some of the Financials stuff is now there. The Financial setup section now holds the billing type, budgets and all that. Let’s have a look at both.
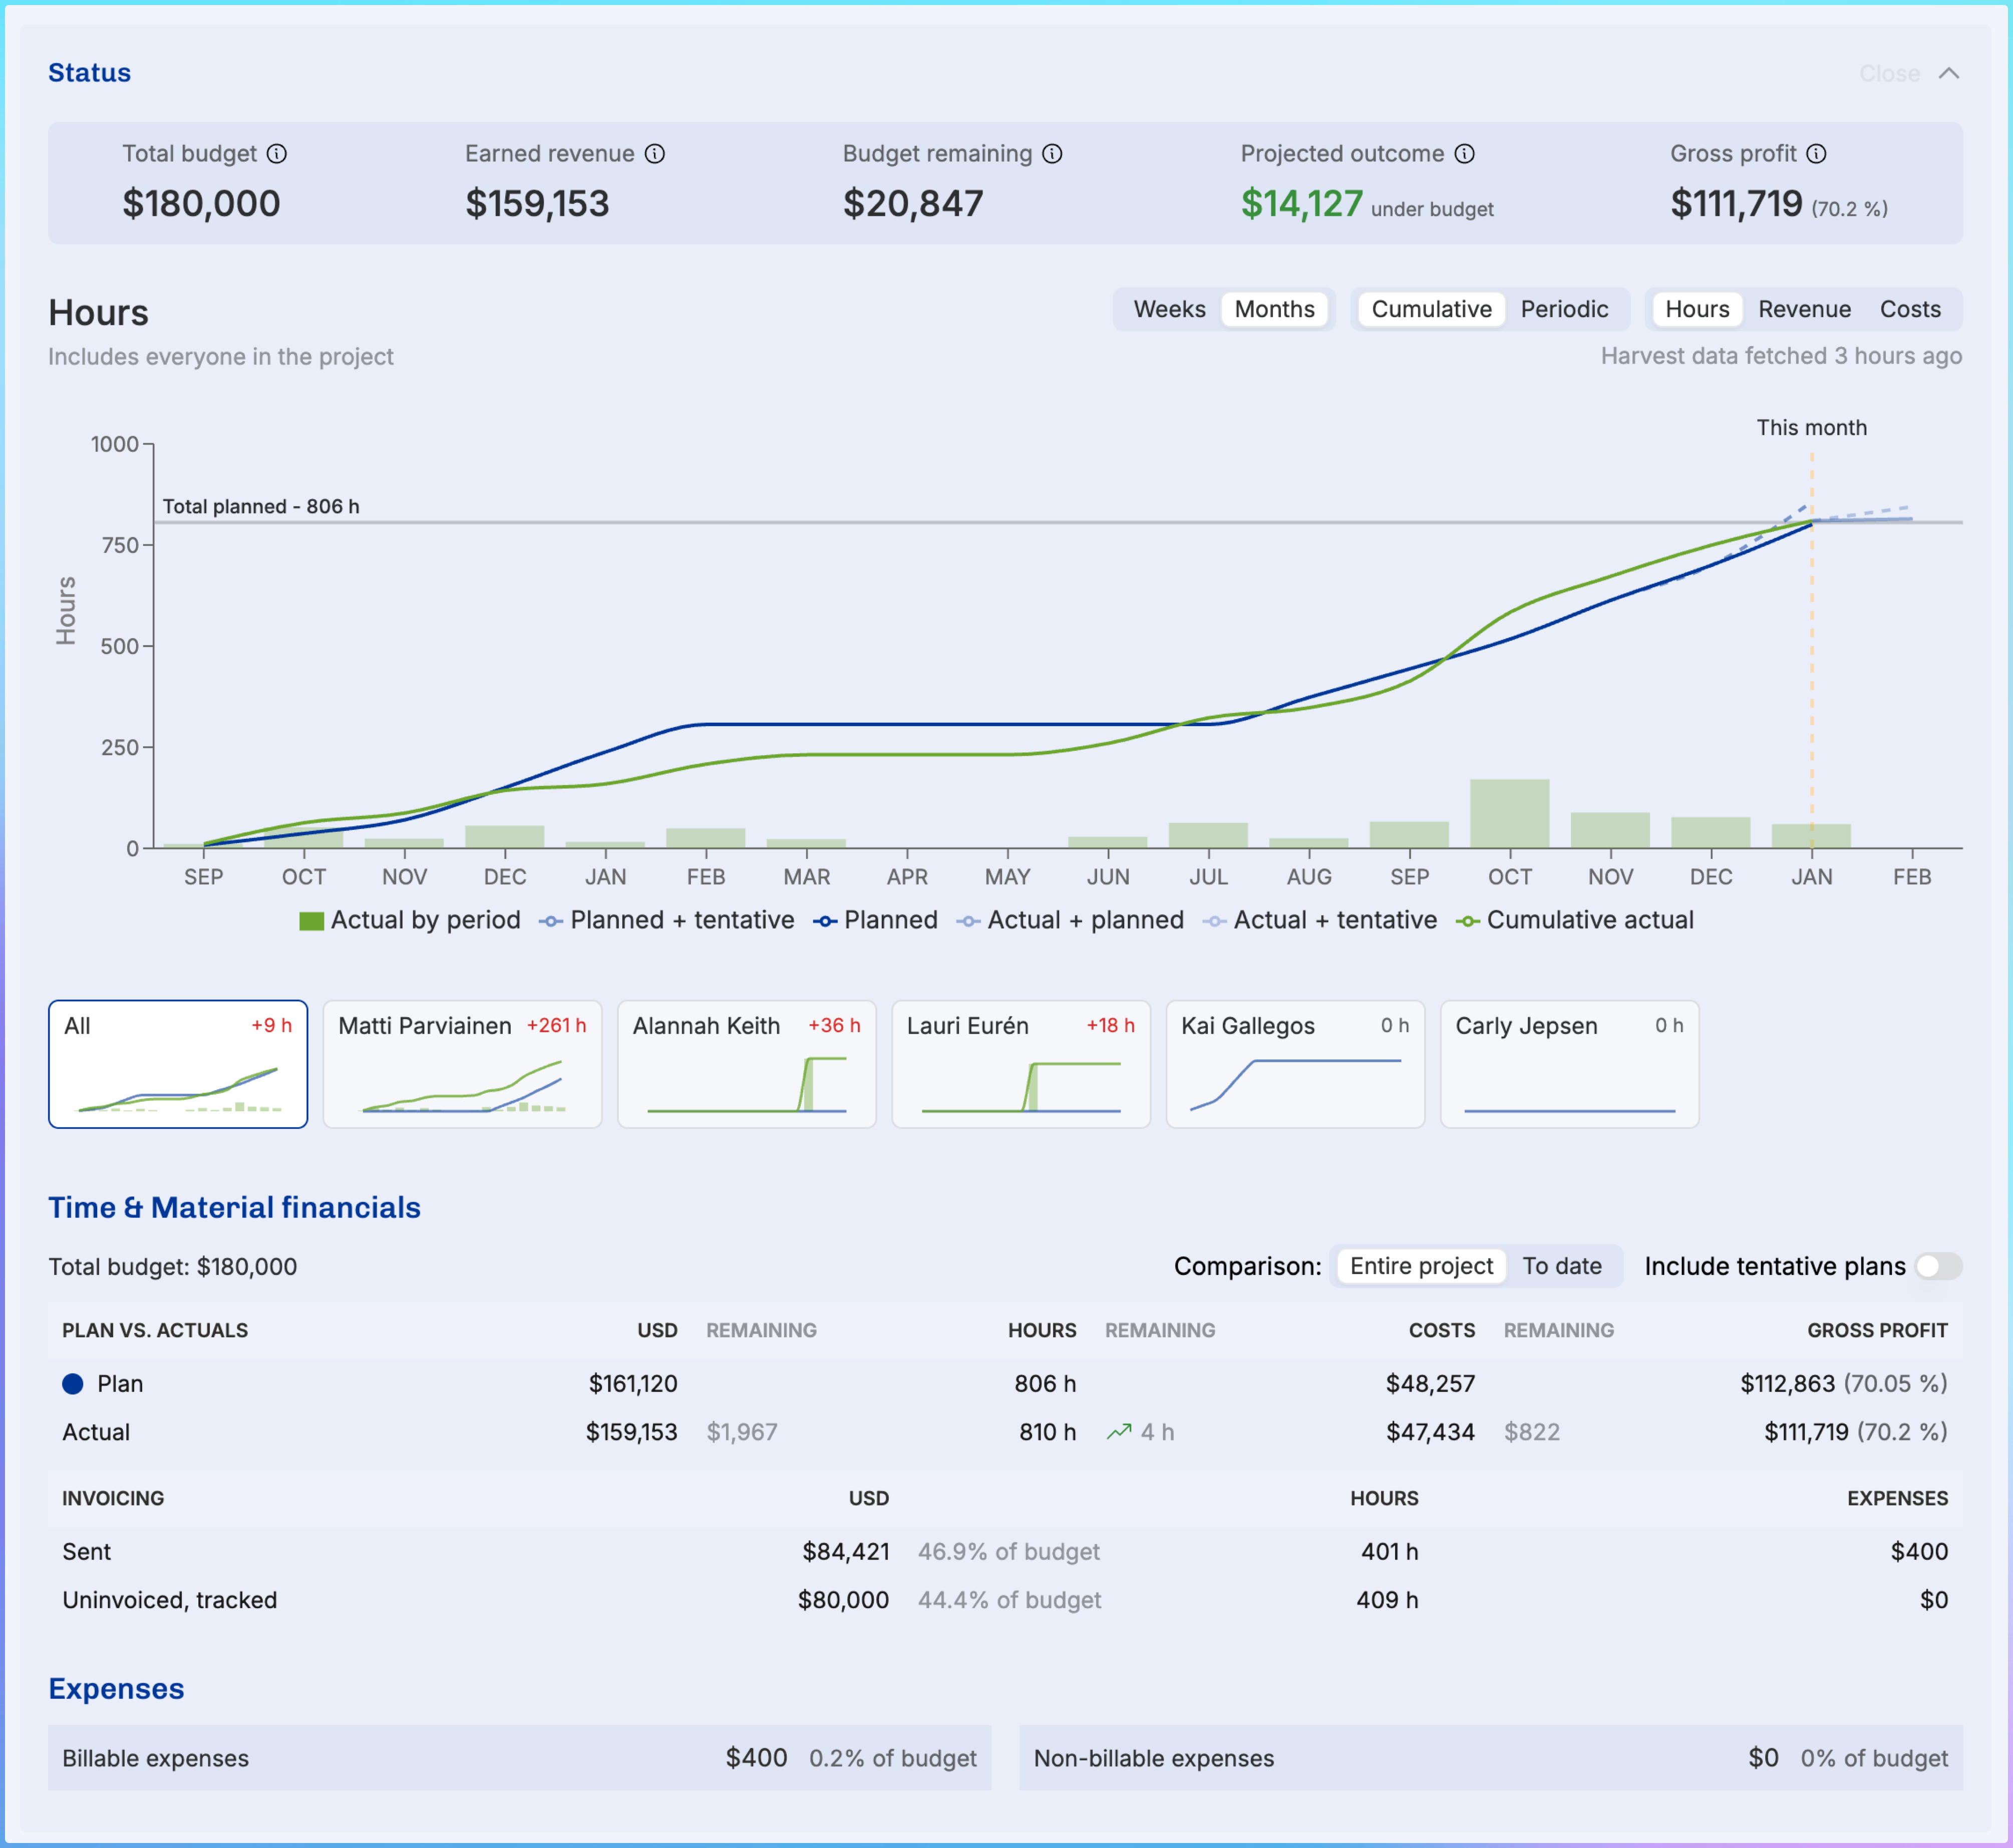
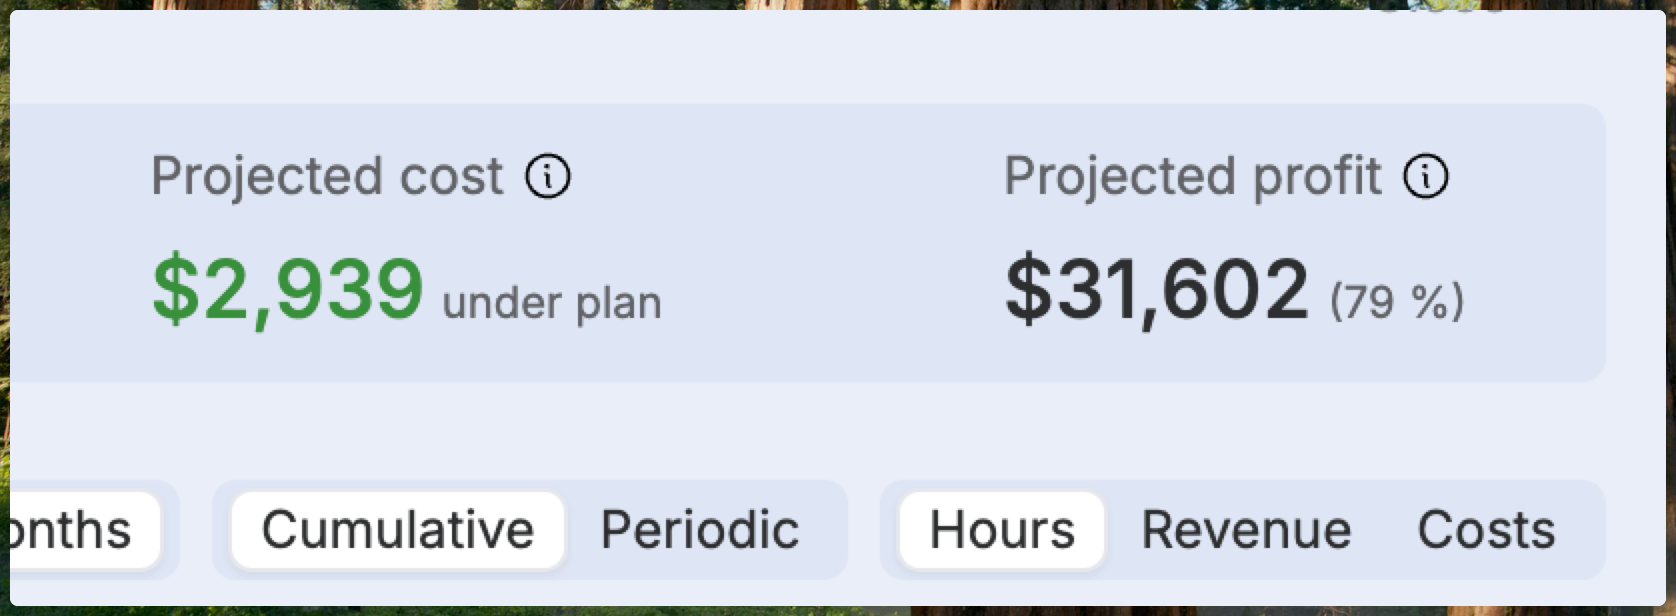
The KPIs on top show the crucial facts about per-hour project’s situation: how much you’re earning (based on time tracked) will you reach the budget, and how much gross profit you will make.
The burnup is powerful: you can look at it through many different lenses.
You can now toggle between the plan vs. actuals for the entire project or from the beginning until today. By default, tentative plans are excluded, but only a click away.
It’s amazing to also see invoicing and expenses right here.
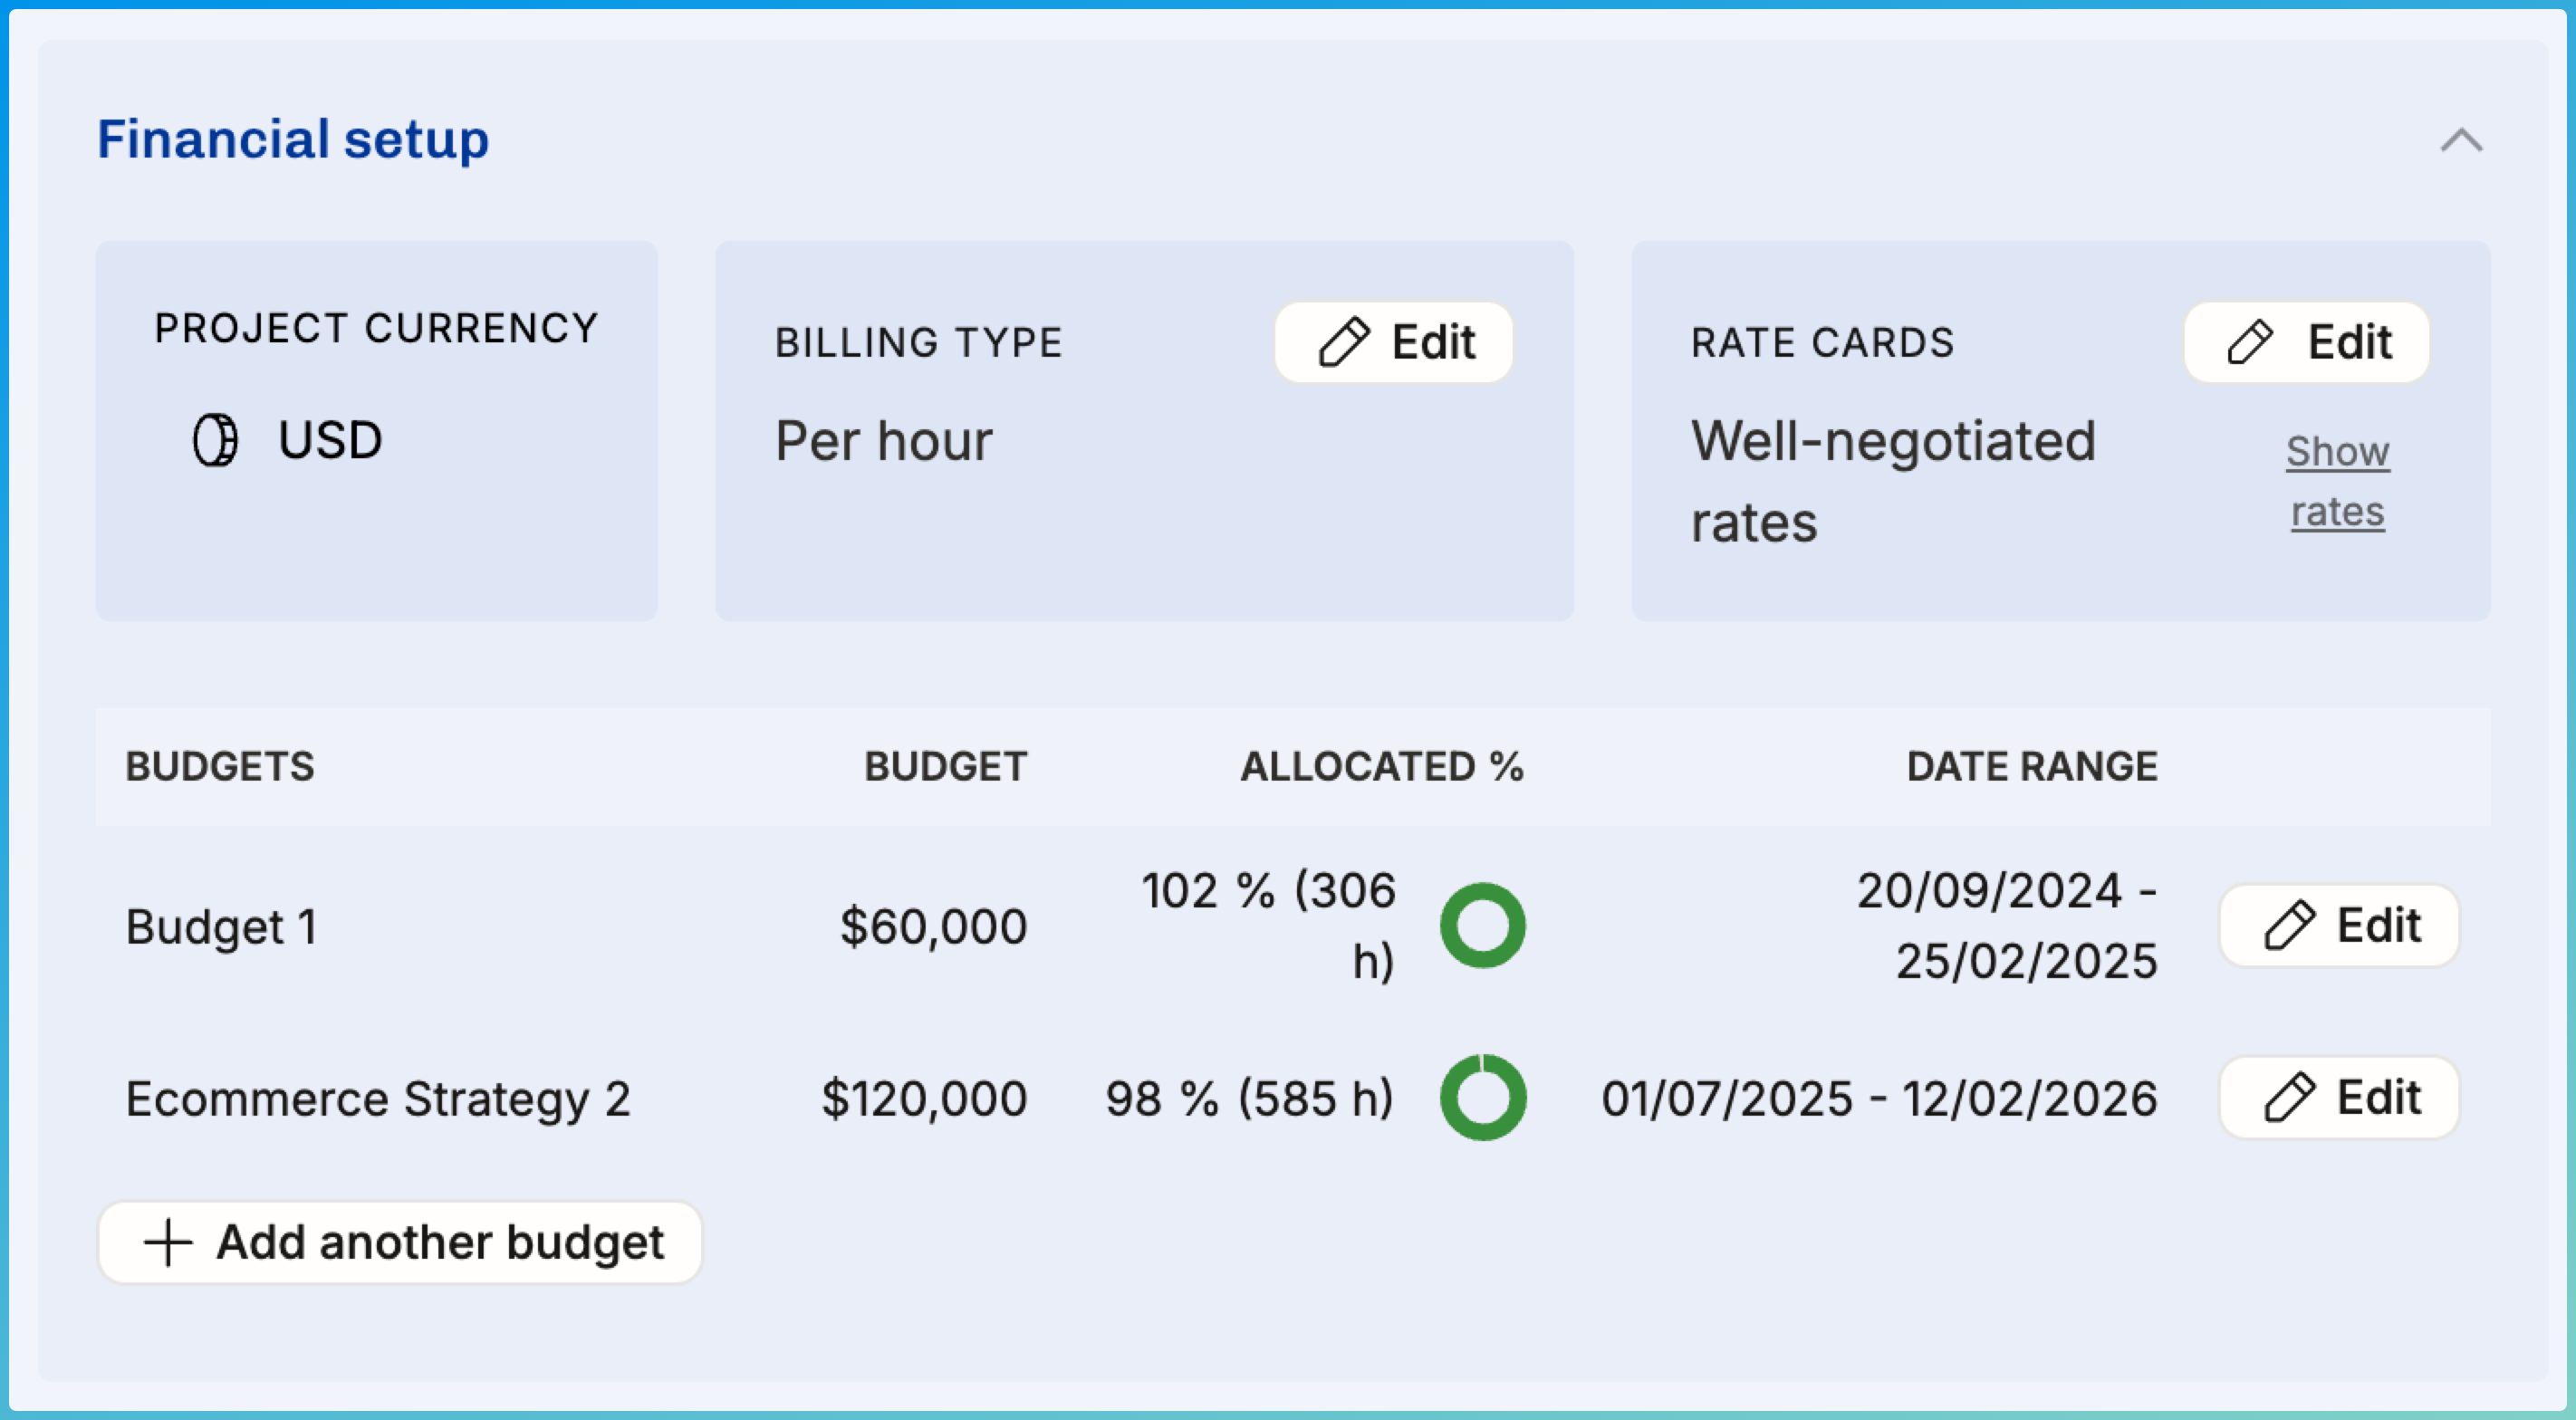
Then, on to the next section: Financial setup – much cleaner now, stating the facts:
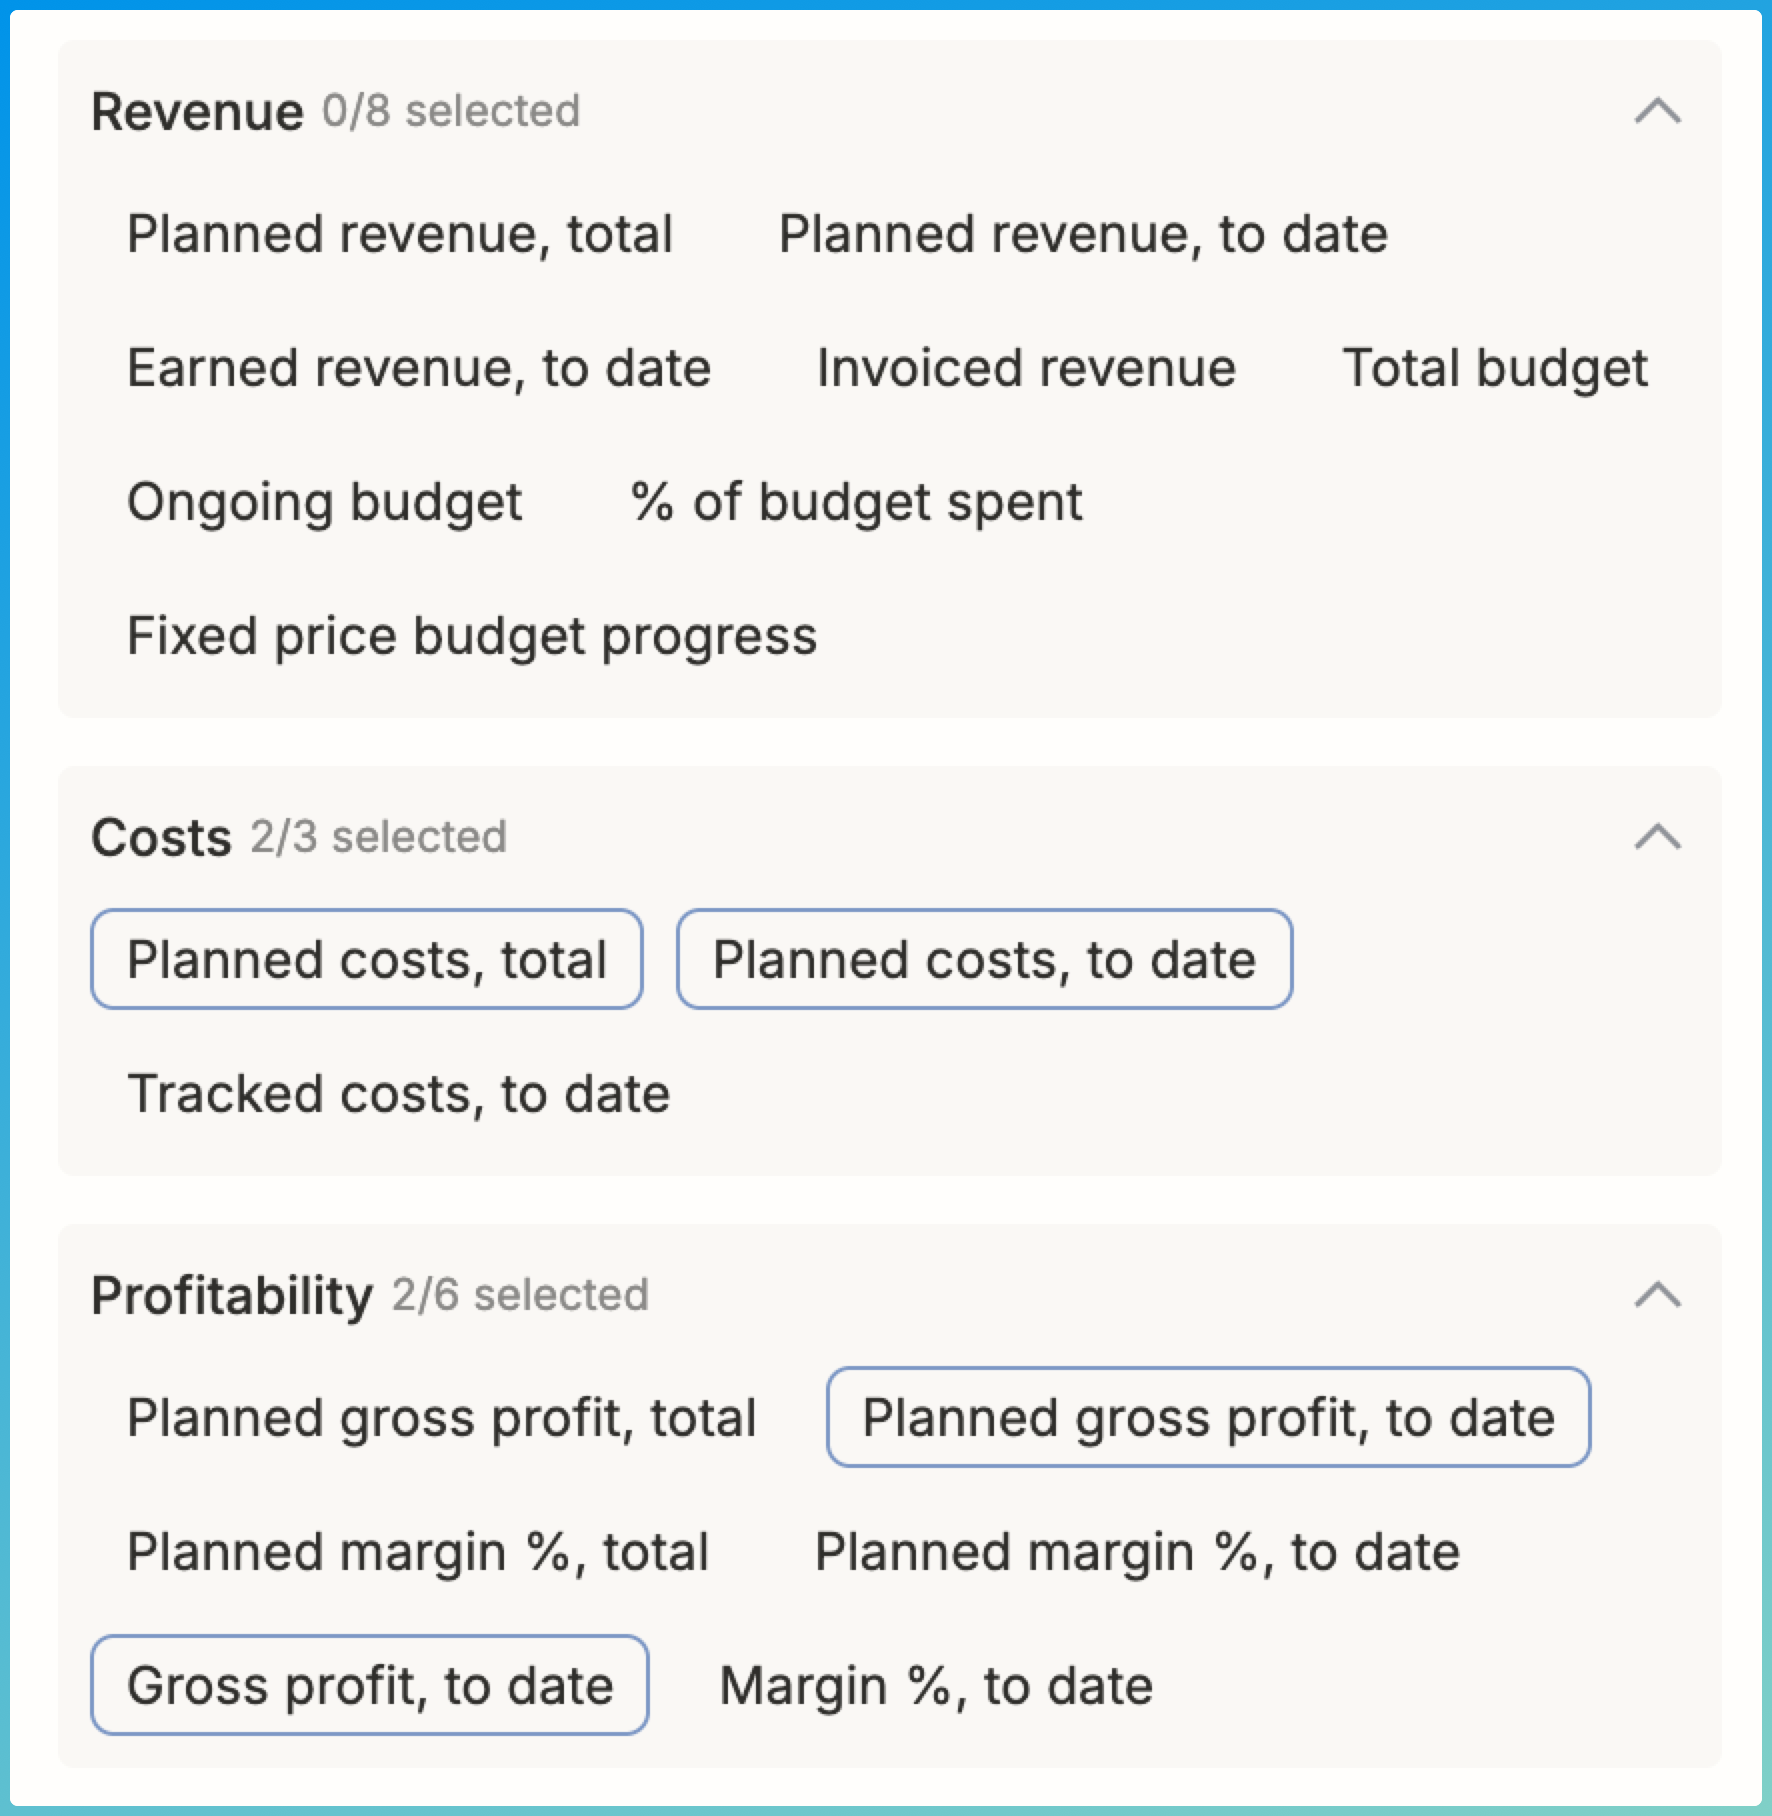
Money & profitability columns in Projects list
We have so many things to show for each project in the project list, we had to put them in these different sections in the Display menu. For a PM or a head of PMO, seeing this information for all the listed projects will surface issues with profitability or if some rows are missing relevant inputs. This is a huge win for data quality in Operating. We also hope that this motivates you to set up cost cards for your company – in our opinion, it’s vital to understand the gross profit of each gig at each stage of its lifecycle.
How much of the Fixed Price work has been done? Set the % to recognize revenue
Still with me? Great! Let’s go have a look at the Financial setup for a Fixed Price project:
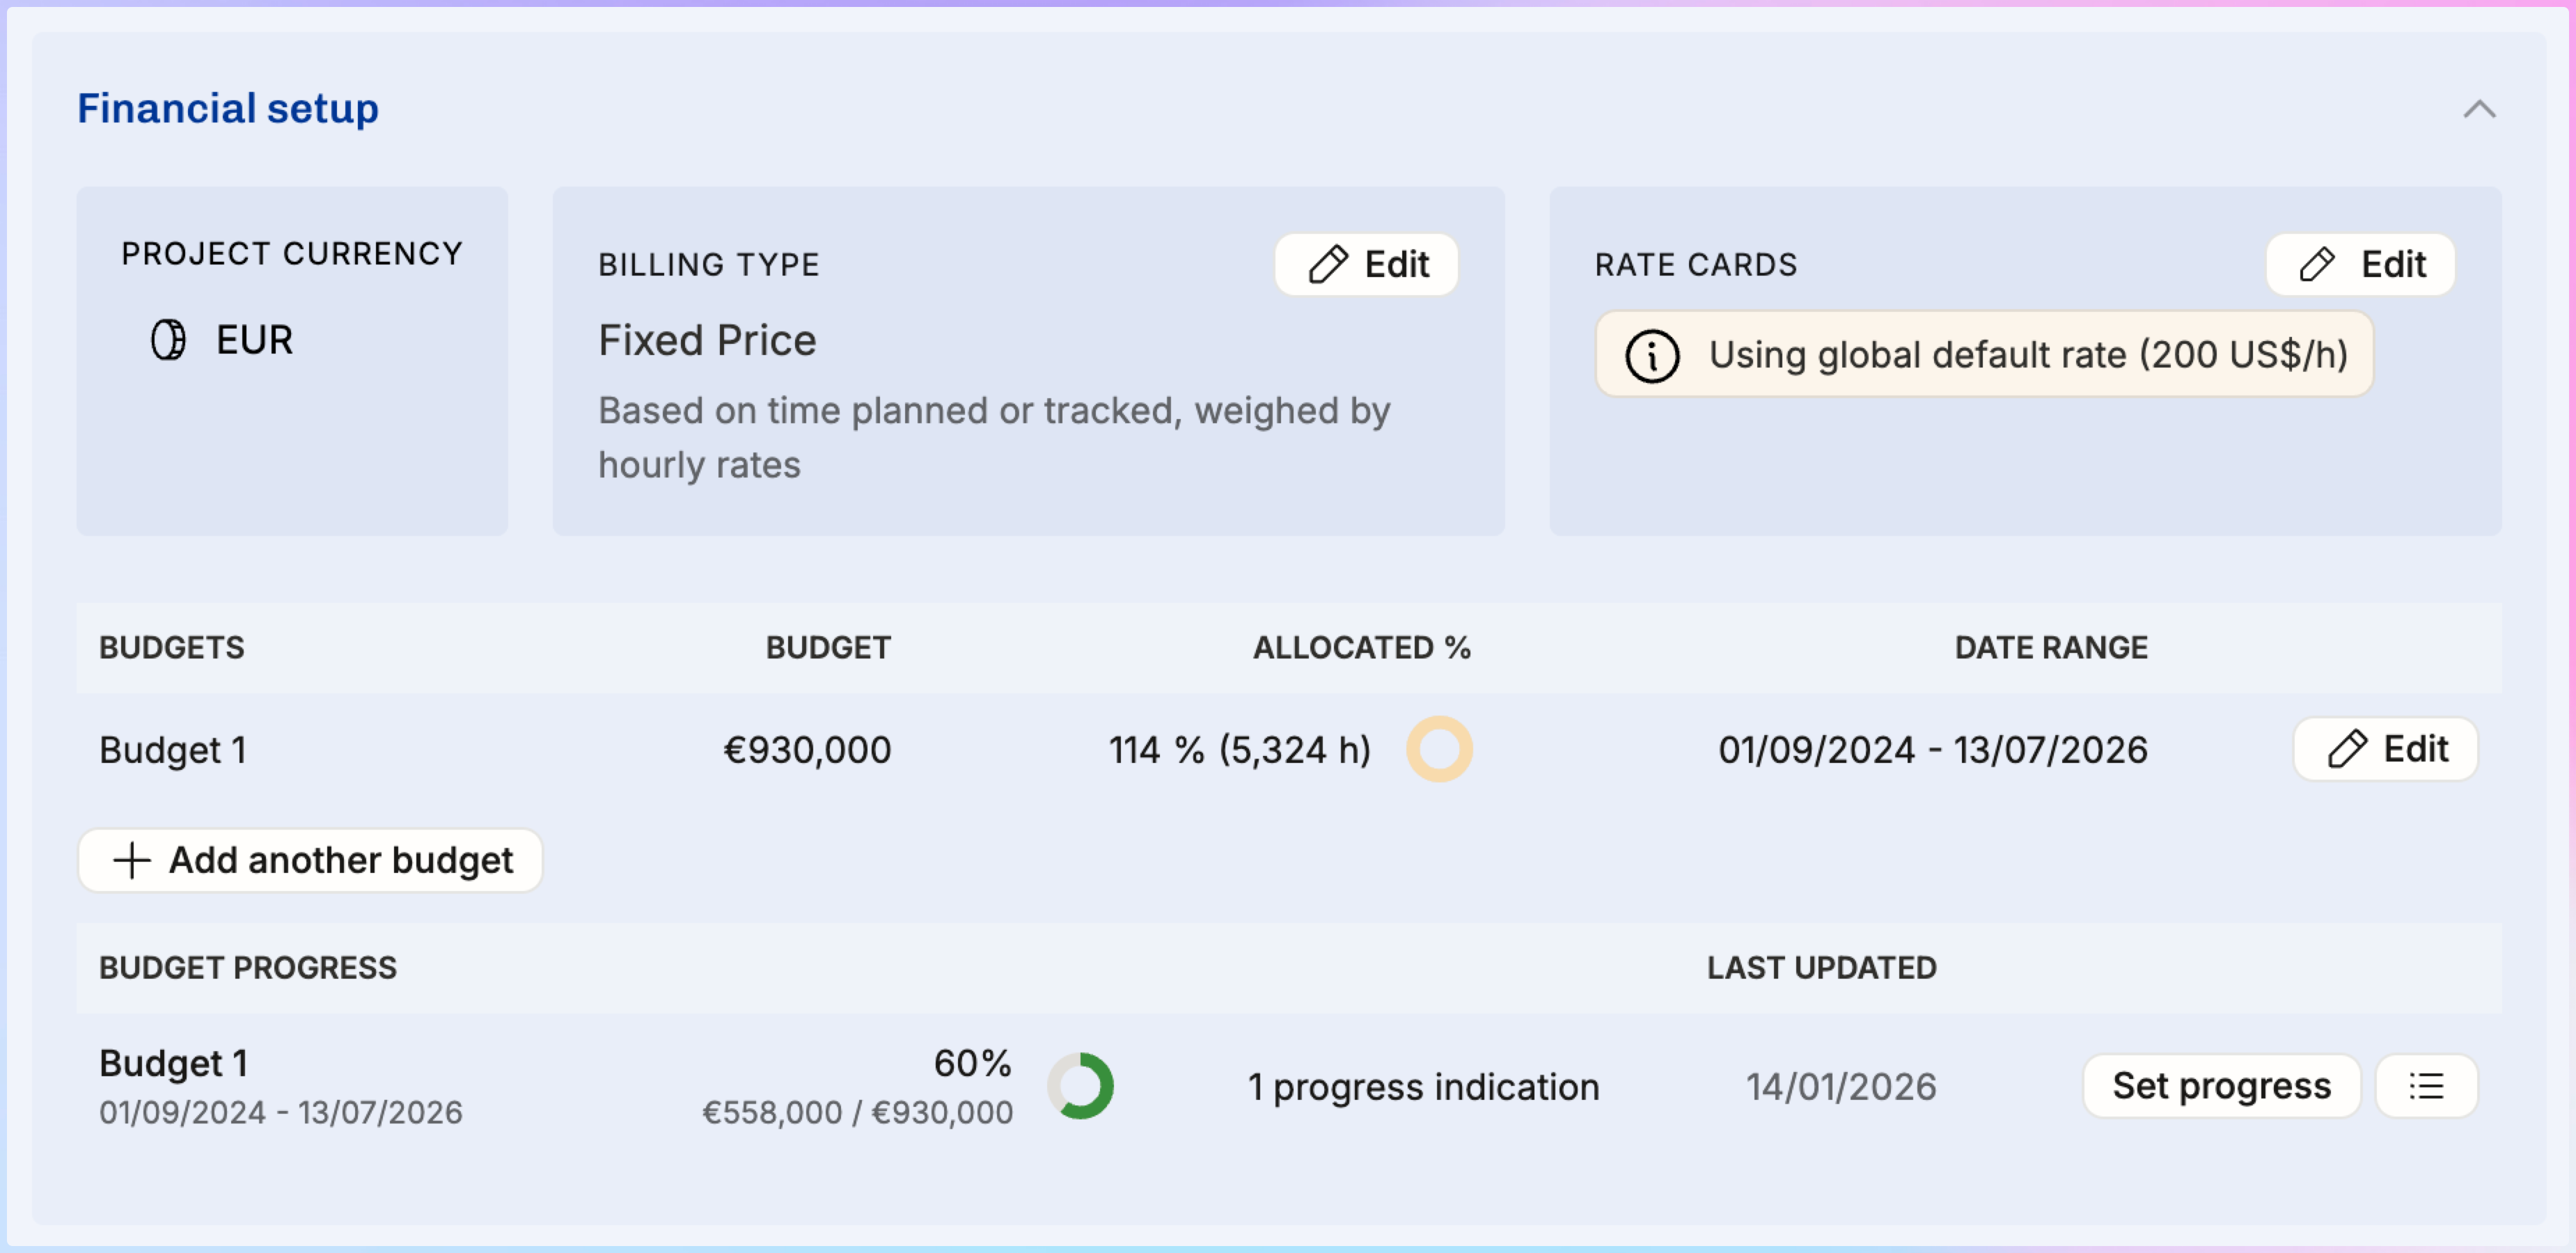
The setup is a bit more complicated, but for a good reason: when you’re selling your services with a true fixed price contract, you know that you will end up invoicing the predetermined revenue. However, in cases that span over many months, you want to know how much revenue have you already earned.
For this, we built the revenue recognition method called “Based on time planned or tracked, weighed by hourly rates”. In our day-to-day, we call it the best RR method. In essence, it looks at the amount of allocations planned in the future (and past) – and time entries tracked in the past, and is able to attribute the revenue to the people who did the work. In the example above, everyone’s time is valued equally (at the global default rate). However, you may have your most experienced specialist whose hour might have the alternative cost of $400. In the same team, you may have juniors working at roughly $80/h. The comparative difference is used when weighing the value of their work.
Now, if you’re halfway through the project, how can you know how much of the revenue has been earned? You must indicate the progress manually. In the above screenshot you see the Budget progress UI. Setting the progress can be done as frequently as you like – some companies do this routinely at the end of each month. Here’s what setting the progress looks like:
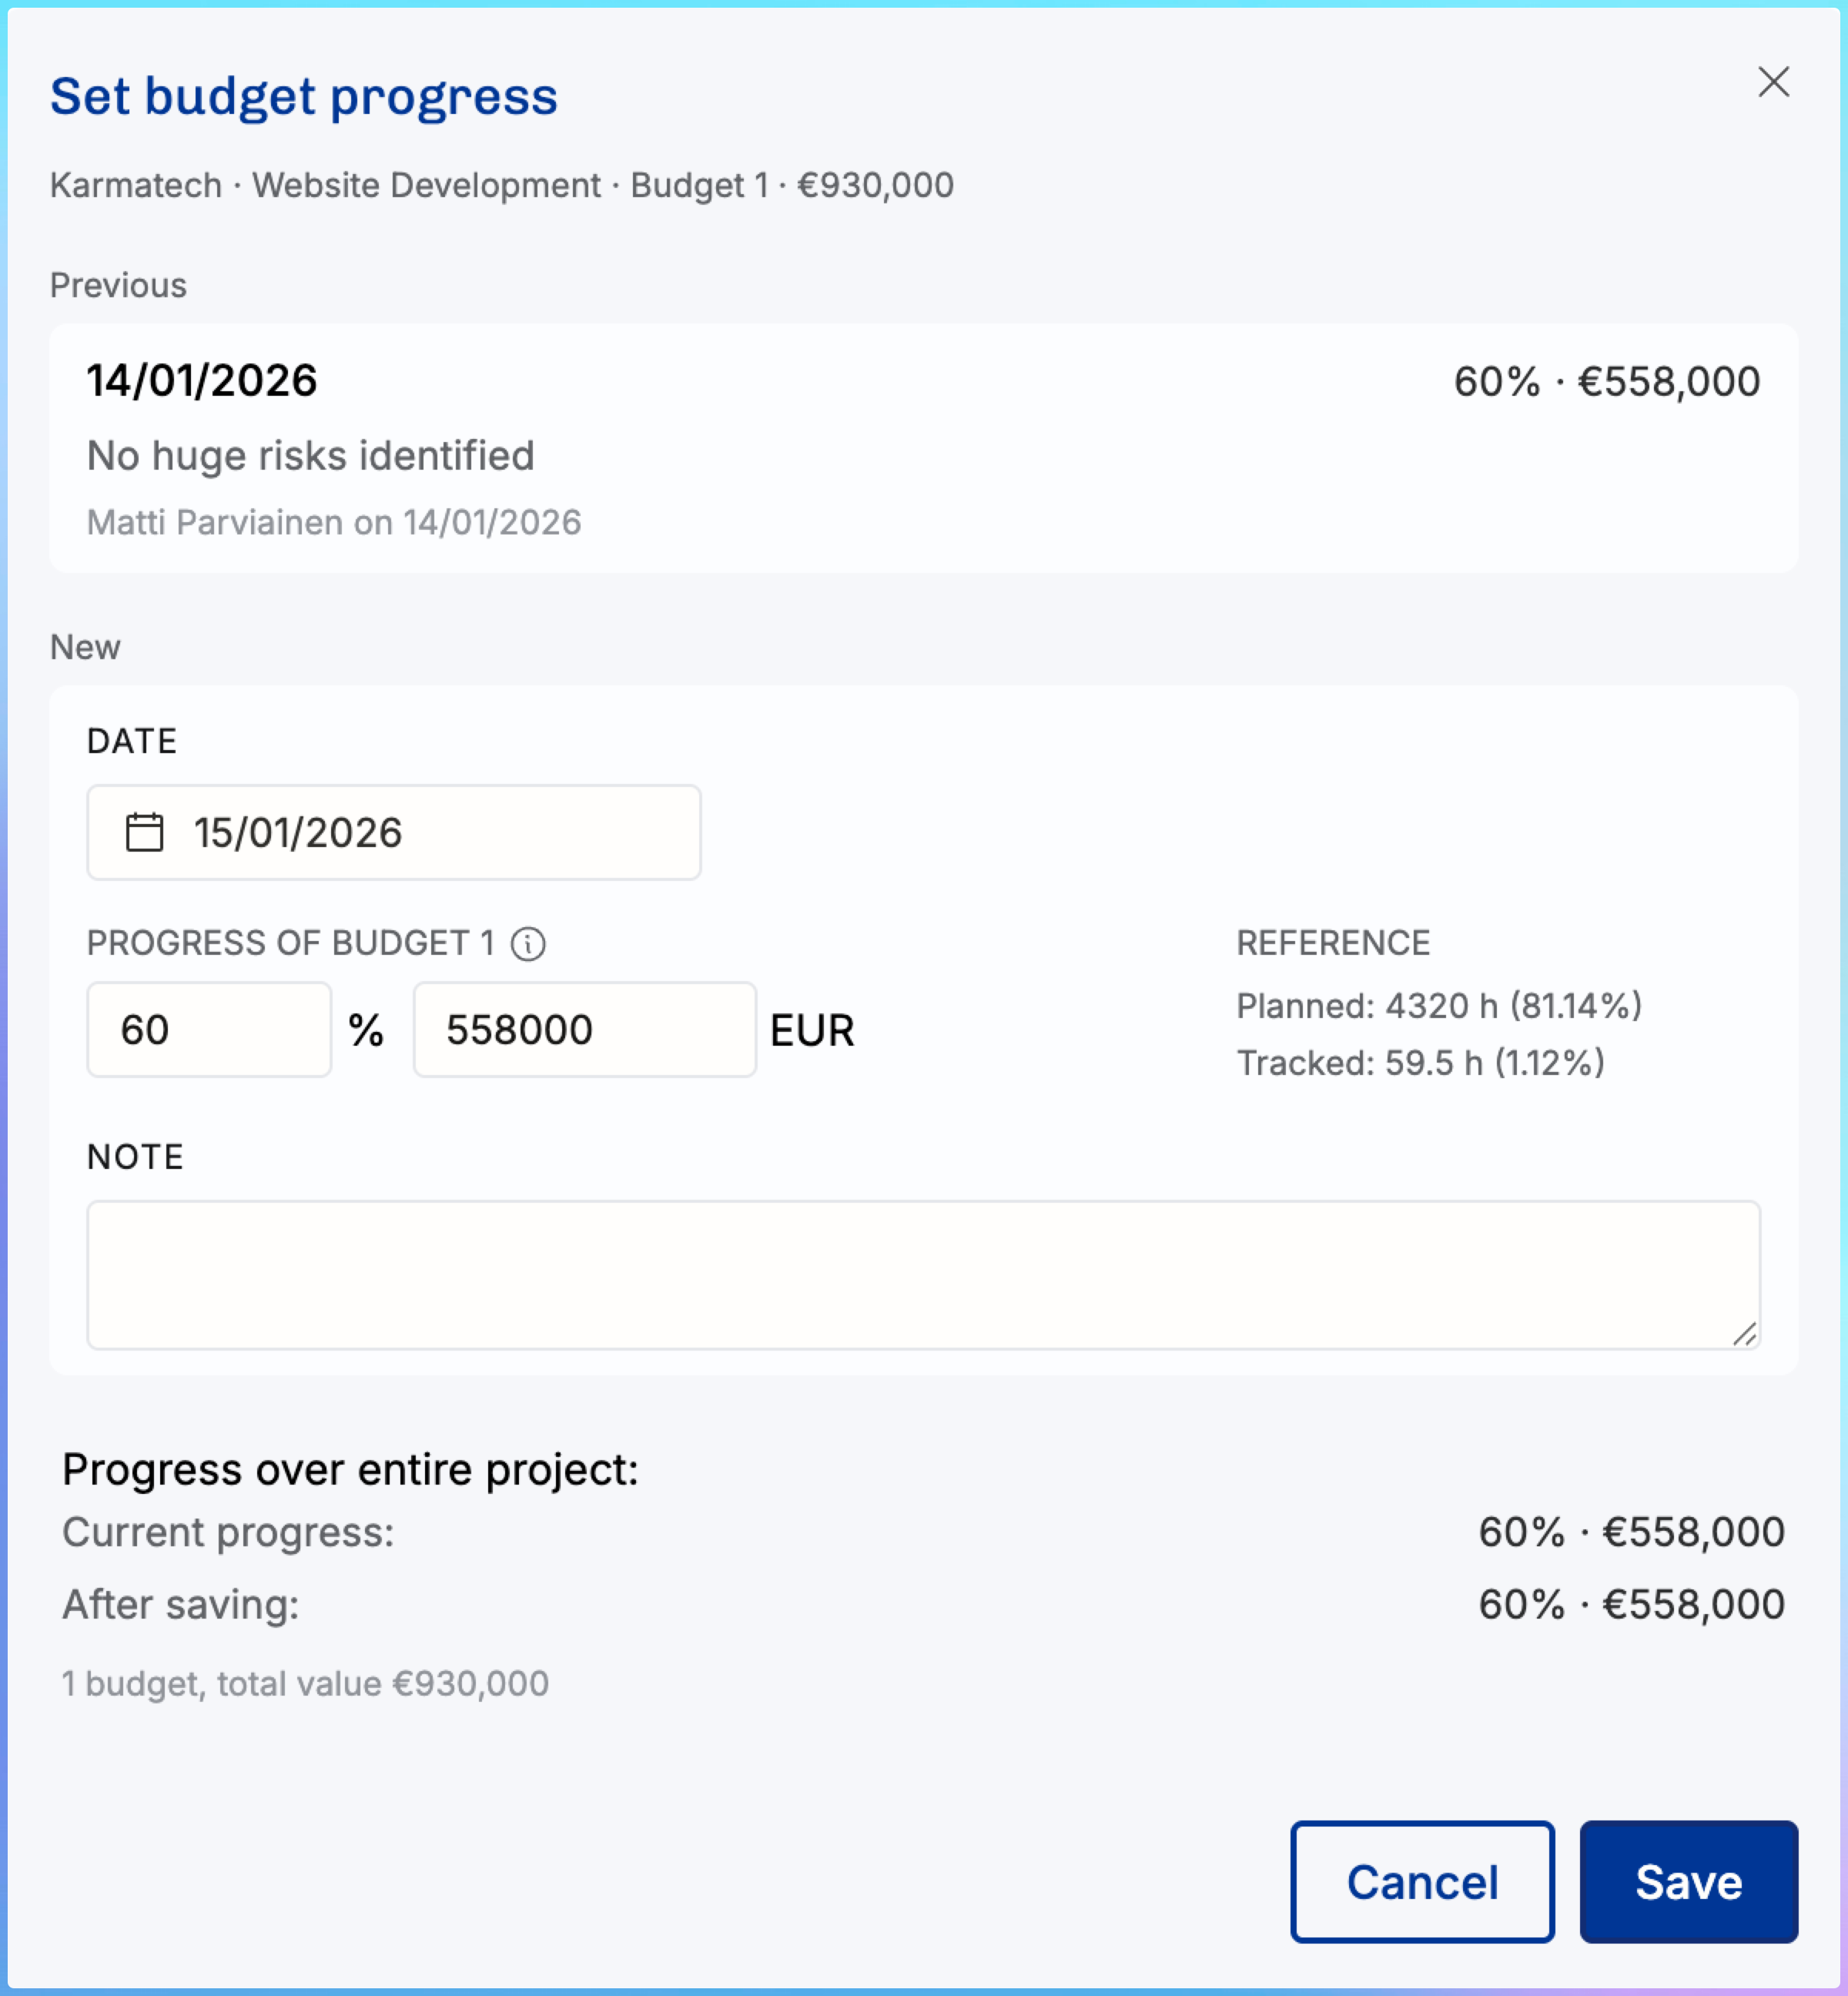
Naturally, not all FP projects require this kind of attention. But especially work spanning over more than one financial reporting period can be managed correctly with this!
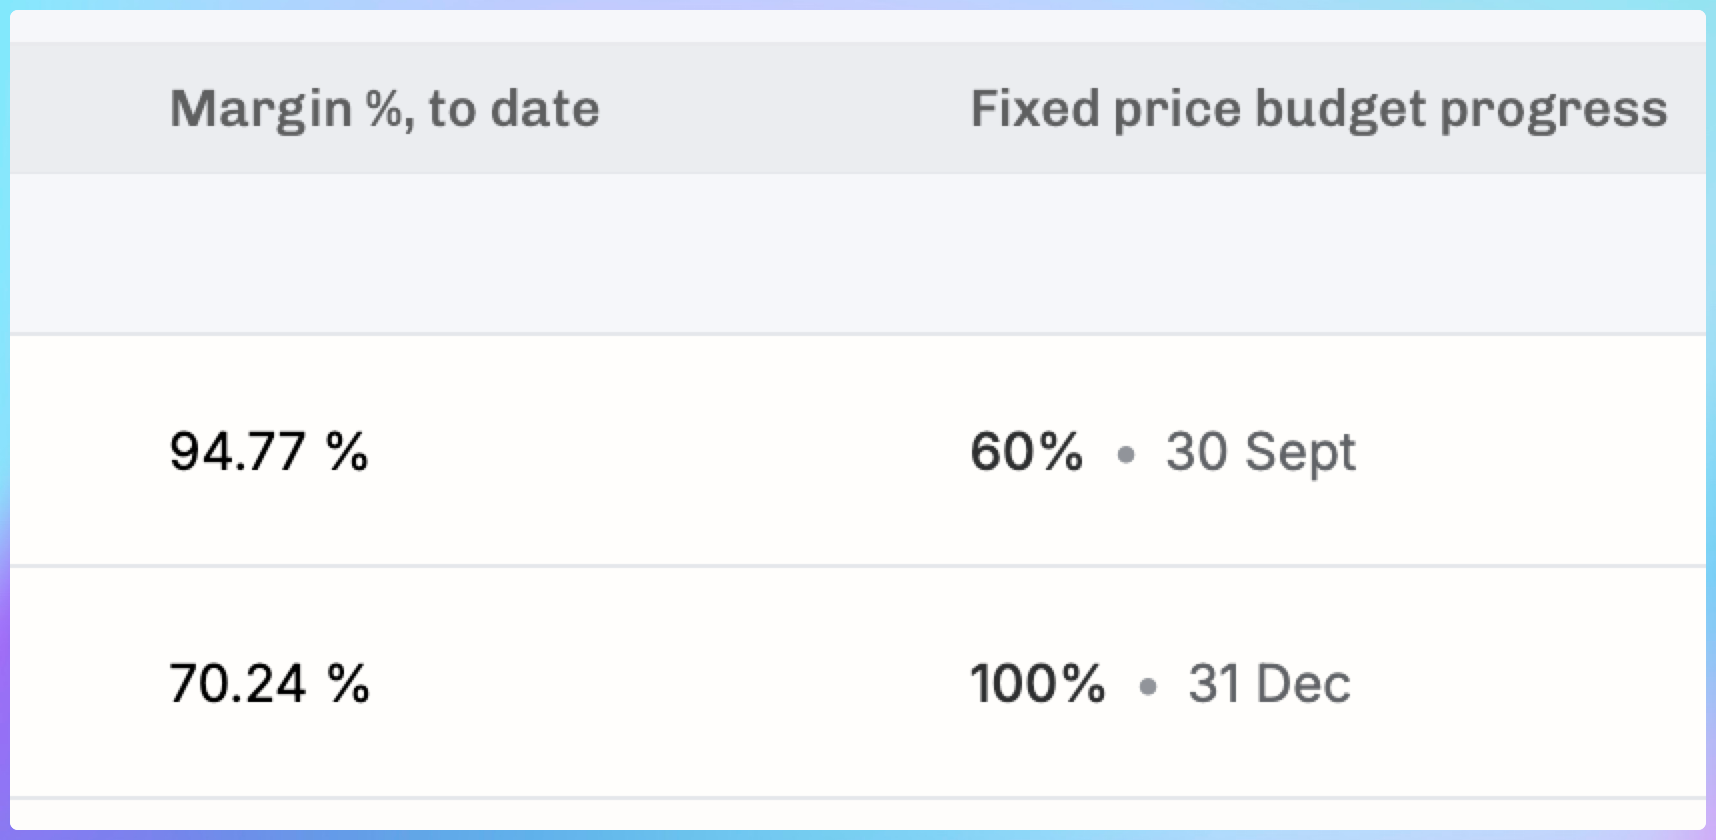
In the Projects list, those setting the FP progress manually will enjoy using columns such as these – showing at a glance what the progress is and when was it last set:
Our other rev-rec methods are Evenly by week and Evenly by month. We let you keep things simple if you don’t require absolute control.
Final heads-up: new navigation going live next week
As we wrote in the previous newsletter, it’s time to get ready for the sidebar navigation launch next week. Most likely on Monday 26th of January. If you want to get ready and have your familiar Horizon in place, get your Pinned Views in order before that.